Custom Widgets for Advanced Searches in NOMAD
One of the strengths of NOMAD is that it allows you to search entries based on rich metadata. There are different types of metadata: some are extracted automatically by NOMAD upon uploading the data (e.g., upload ID, date, and author), others are generated by NOMAD parsers, and some are provided directly by the user. Once data and metadata are connected through schemas in NOMAD, it becomes possible to search within these datasets using NOMAD's search filters.
In NOMAD, the author has the choice to provide rich metadata or simply use the software as a basic storage platform. If rich metadata is provided according to schemas, it can be effectively used for searching. On the other hand, if (meta)data are provided not according to schemas (e.g., in free text fields) or stored externally, it cannot be utilized for searchability within NOMAD.
Once (meta)data are stored using schemas in NOMAD they become machine-actionable. NOMAD has built-in customizable widgets that allow users to create advanced dashboards for exploring data. The buttons to create customizable widgets are located just below the search bar, once you are in any NOMAD page selected from the EXPLORE menu.
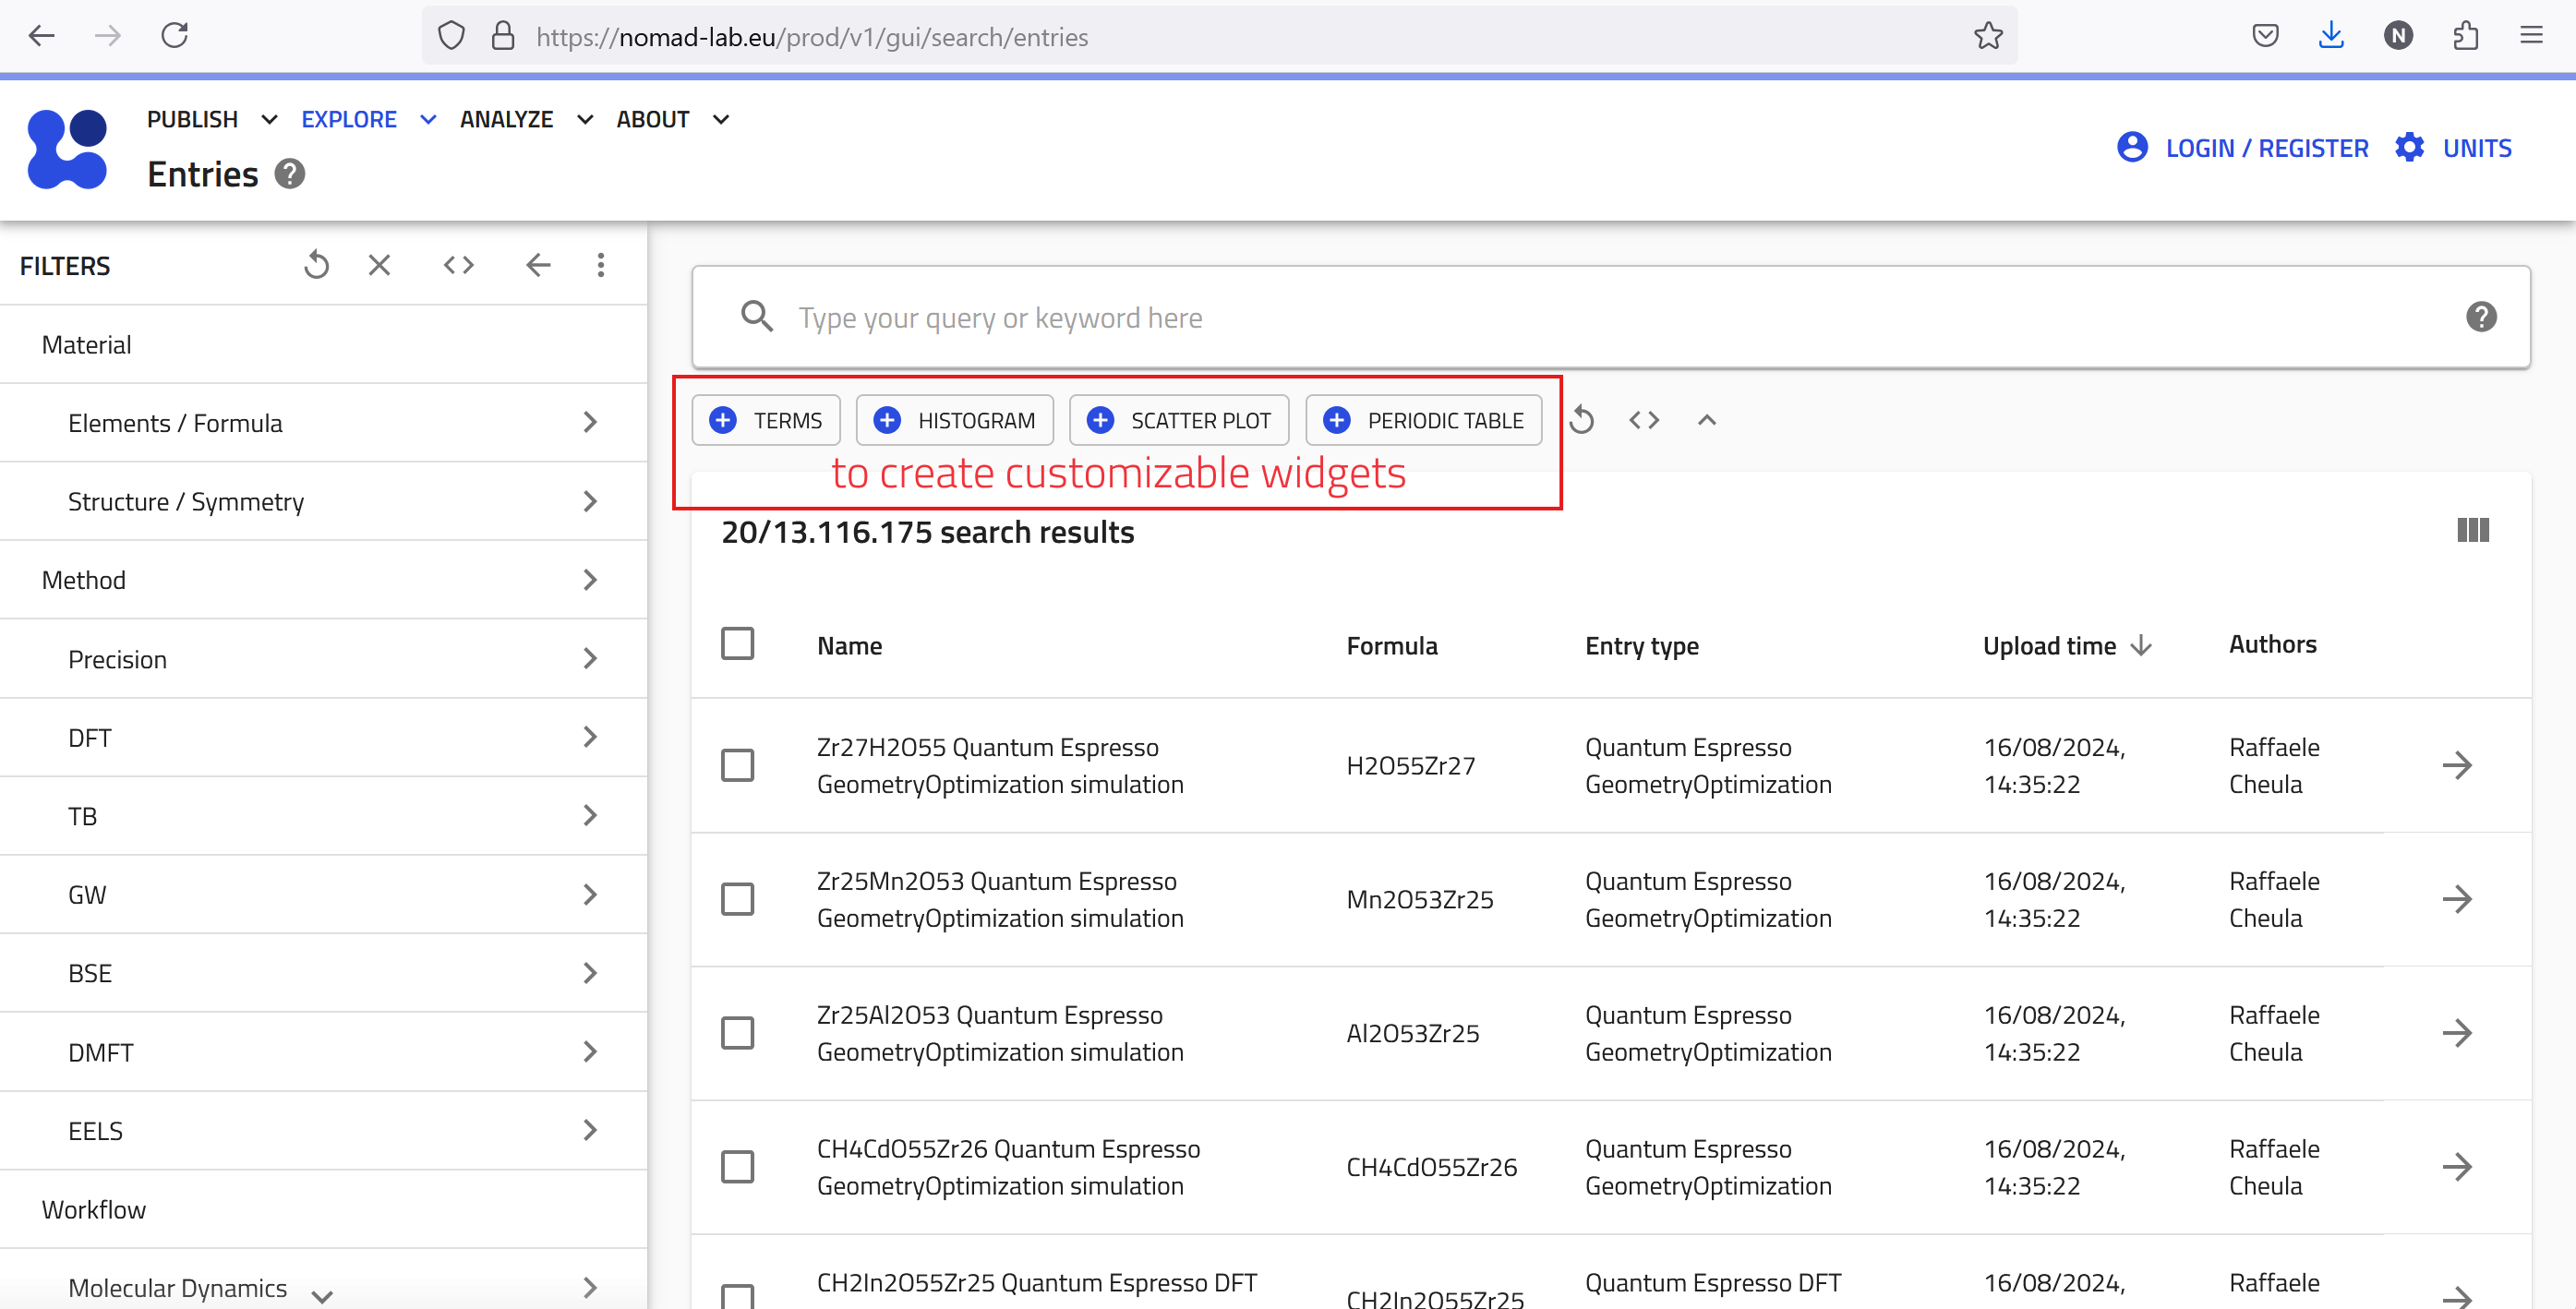
Here are the main four widgets:
- TERMS: Visualize and explore categorical data based on user-defined terms and keywords.
- HISTOGRAM: Display the distribution of a specific numerical quantity within data.
- SCATTER PLOT: Generate scatter plots to visualize relationships between different quantities.
- PERIODIC TABLE: Filter data by selecting elements directly from an interactive periodic table.
Create Customizable Widgets For ETL Materials in Solar Cells
In the following, we'll walk you through an example to help you better understand how to use these widgets. Imagine we are working on solar cell research and have fabricated solar cell devices using the absorber material 'CsPbBrI' (Cesium Lead Bromine Iodide), a mixed halide perovskite. The device's structure is illustrated below:
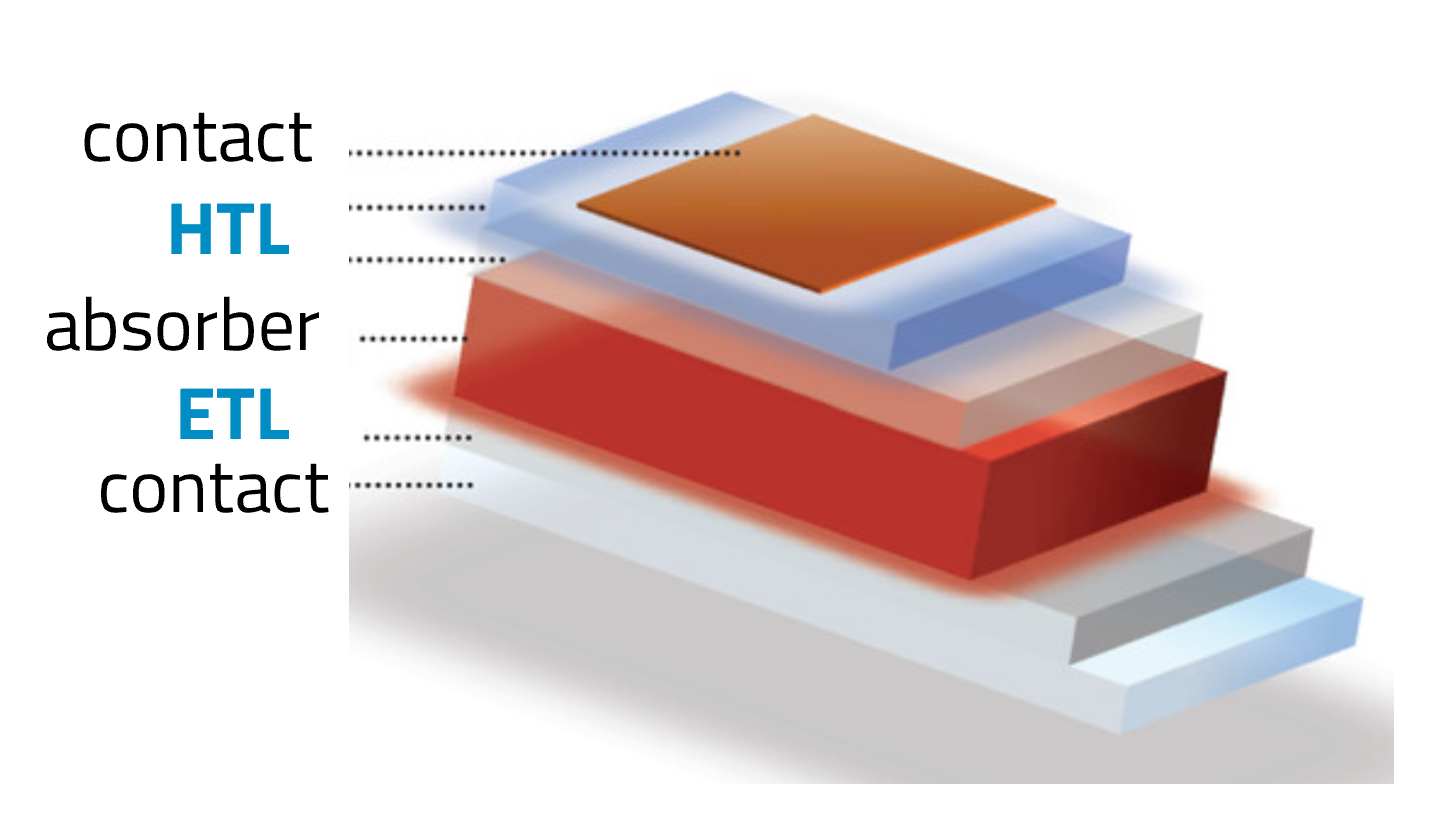
The Device:
- Contact: Au
- HTL (Hole Transport Layer): Spiro-OMeTAD (C81H68N4O8)
- Perovskite Absorber: CsPbBrI
- ETL (Electron Transport Layer): TiO2-c (compact Titanium Dioxide)
- Contact: FTO (Fluorine-doped Tin Oxide)
- Substrate: SLG (Soda Lime Glass)
Now, we want to answer the following research question:
Research Question:
What ETL materials can replace TiO2-c to improve Voc (open circuit voltage) in perovskite solar cells?
To gain insights into this question, we can utilize NOMAD's widgets to explore relevant data:
-
Start with the Periodic Table:
- Click on the PERIODIC TABLE widget button and use the (+) button to pin it to the dashboard. <!-- this is not comprehinsive - clicking on the button opens a dialog box. There is no Plus icon>
- Select the elements of the absorber from the periodic table: Cs, Pb, Br, and I.
- After selecting these elements, you should see approximately 7,500 entries matching your search filters.
-
Use the TERMS Widget:
- To find out what ETL and HTL materials are used in the available data, click on the TERMS widget button.
- For the X-axis, type 'electron transport layer'. As you type, suggestions will appear. Choose
results.properties.optoelectronic.solar_cell.electron_transport_layer. <!-- screenshots or short gifs will be helpful> - Set the statistics scaling to linear, give the widget a descriptive title like "ETL", and pin it to the dashboard.
- Repeat the process for the HTL materials.
-
Create a Scatter Plot:
- Click on the SCATTER PLOT widget button to visualize the relationship between open circute voltage (Voc), short circuit current density (Jsc), and efficiency.
- Set the X-axis to "Open Circuit Voltage (V)", the Y-axis to "Efficiency", and use the marker color to represent "Short Circuit Current Density".
- The scatter plot will allow you to explore the data interactively.
Interpreting the Results
With the widgets configured, you can now explore the relationships between different ETL and HTL materials and their impact on efficiency, Voc, and short circuit current density. The scatter plot is interactive, allowing you to zoom in on specific data points. Hovering over a data point will display the exact values for the chosen properties. Clicking on a data point will take you to the corresponding entry page, where you can view detailed metadata, check if the data belongs to a dataset, and see if it has been published in a journal or has an associated DOI.
NOMAD's customizable widgets offer a powerful way to gain insights from vast datasets, helping you to answer complex research questions and discover new patterns in data in short time.